Lately I am exploring how to create a 3D map with mapbox and automate certain tasks with KNIME to visualize geolocated data. There is more and more geopositioned information and being able to visualize it quickly and easily embedded in a web page is the best way to analyze it. But how do we approach the whole process without programming?
The challenge: create a 3D map
As you know, I have a special interest in the Camino de Santiago. Combining engineering and the Camino allows me to help my fellow pilgrims by showing them data that would otherwise be difficult to obtain. Or just looking at them in a different way.
In this case, the challenge was as follows:
- Using public information from the CNIG about all the Caminos de Santiago in the peninsula, visualize them in an embedded form in an article of my web page.
- Providing extra added value to GPS positions
- Use #nocode tools and share it in a way that anyone could replicate and improve it.
Starting data
As I said before, the starting data are all the GPX files available in the CNIG portal (Spanish National Center of Geographic Information). This information has been provided by the Asociación de Amigos del Camino de Santiago.
After downloading each of the 1,015 individual files corresponding to all the stages of all the variants of all the Caminos, I have unified them into a single database of GPS points.
Using the nocode tool par excellence, KNIME Data Science & Analytics Platform, for this loading and transformation process (ETL), in addition to the massive processing of more than 398,000 GPS points, and as an added value, I wanted to include the elevation data of each of the coordinate points.
First problem: missing elevation data
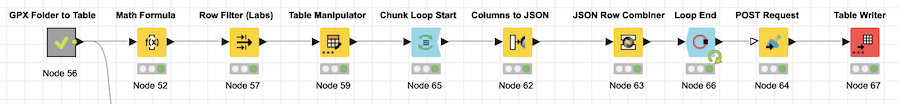
During data ingestion, I realized that there were stages and caminos that did not have elevation information, so I looked for an API service (open-elevation.com) that would automate those queries. By being cautious with calls, I was able to download over 105,000 points that had zero or no elevation information in less than 4 minutes. The steps would be as follows:
- Identify points that have no elevation data or have an error.
- Filter this data to generate the json that we will use for the requests to the open-elevation.com service.
- Generate a loop to launch a maximum of 1,000 points per call.
- Generate the json with the latitude and longitude data with the required format. The nodes in this case would be:
- Now we have a JSON table that will have the arguments for the POST of the call. This way we will only have to use a POST Request node with a delay of 2,000 ms.
Displaying elevation information visually
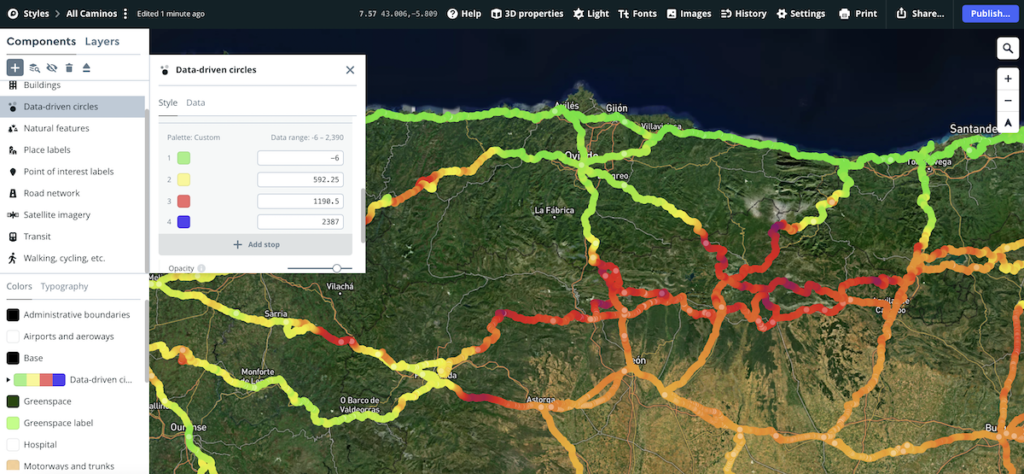
Before moving on to the next challenge, i.e. integrating mapbox, let’s check that the data obtained is at least consistent. To do this, we will first unify the 398,000 points and use KNIME’s quick display capabilities. We will make a first test with Open Street Map and Bing Maps (OSM Map View node).
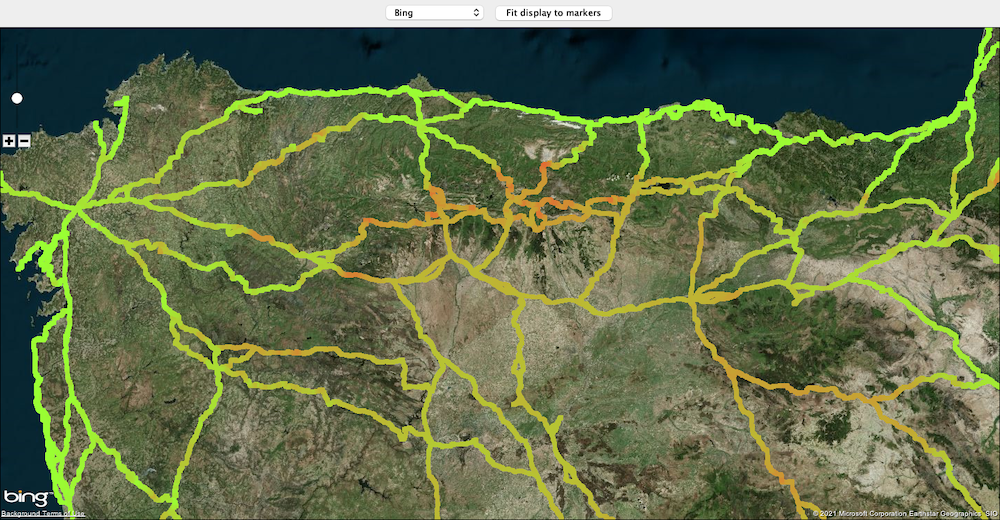
If we look at areas such as Cruz de Ferro (León) or the areas of Picos de Europa, we can clearly see how the tonality changes, indicating a greater elevation of the terrain. We are doing well so far.
mapbox and 3D map: connecting to the service
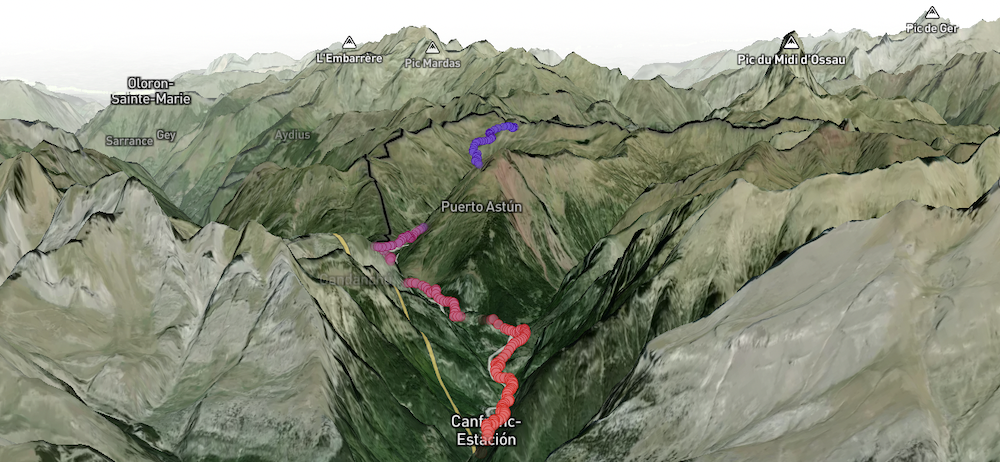
After processing, I used the mapbox map service to display all the information on the 3D engine. Agile mode: let’s start by importing all the points in the mapbox editor (mapbox Studio) and check if we can integrate it in a web article.
- Create a new style with the Terrain 3D visualization on which to display the information of the points we have processed.
- Create a new tileset by importing the generated CSV with the following information:
- Camino’s id
- Stage’s id
- description of the Camino
- description of the stage
- latitude (column latitude)
- longitude (column longitude)
- elevation (column elevation)
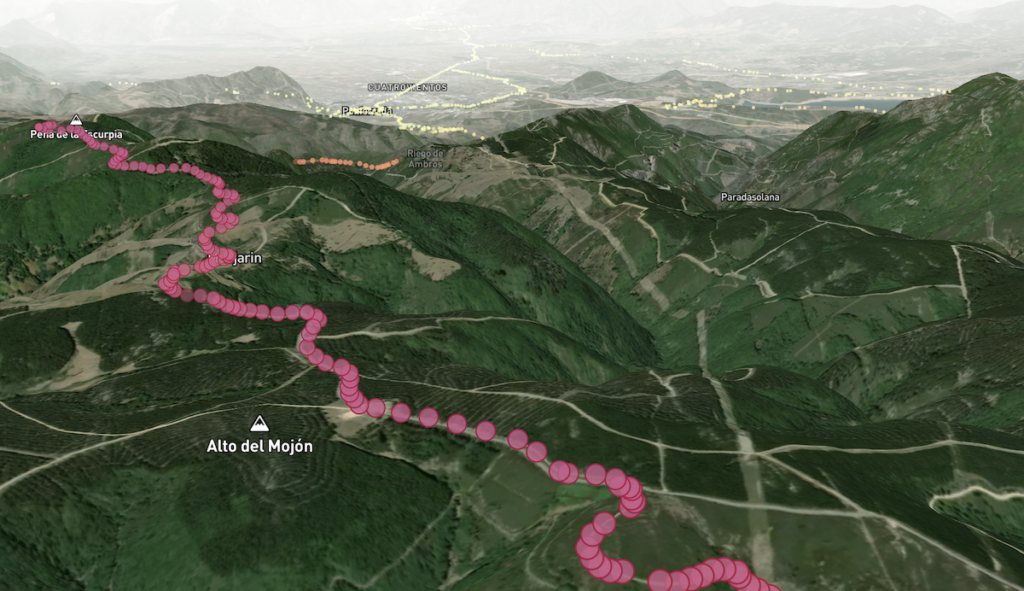
- We associate the tileset with the sytle and then adjust the display according to the height. Here is a screenshot.
Now we just have to publish it and embed it on our website. After searching for how to do it, the truth is that it was simpler than it seemed. Here you have the code to integrate it in your website.
<style>
.mapboxgl-popup {
max-width: 400px;
font: 12px/20px 'Helvetica Neue', Arial, Helvetica, sans-serif;
}
</style>

<script src="https://api.mapbox.com/mapbox-gl-js/v2.3.1/mapbox-gl.js"></script><link href="https://api.mapbox.com/mapbox-gl-js/v2.3.1/mapbox-gl.css" rel="stylesheet"><div id="map" style="width: 100%; height: 1000px;"></div>
<script>
  mapboxgl.accessToken = '[accessToken]';
  var map = new mapboxgl.Map({
    container: 'map',
    style: 'mapbox://styles/[user]/[style]',
    center: [-8.324828, 42.566433],
    zoom: 7.1
  });
// Add zoom and rotation controls to the map.
map.addControl(new mapboxgl.NavigationControl());
map.addControl(new mapboxgl.FullscreenControl());

// When a click event occurs on a feature in the places layer, open a popup at the
// location of the feature, with description HTML from its properties.
map.on('click', 'data-driven-circles', (e) => {
// Copy coordinates array.
const coordinates = e.features[0].geometry.coordinates.slice();
const camino = e.features[0].properties.camino;
const stage = e.features[0].properties.stage_description;

// Ensure that if the map is zoomed out such that multiple
// copies of the feature are visible, the popup appears
// over the copy being pointed to.
while (Math.abs(e.lngLat.lng - coordinates[0]) > 180) {
coordinates[0] += e.lngLat.lng > coordinates[0] ? 360 : -360;
}

new mapboxgl.Popup({closeButton: false})
.setLngLat(coordinates)
.setText(camino+' | '+stage)
.addTo(map);
});

// Change the cursor to a pointer when the mouse is over the places layer.
map.on('mouseenter', 'data-driven-circles', () => {
map.getCanvas().style.cursor = 'pointer';
});

// Change it back to a pointer when it leaves.
map.on('mouseleave', 'data-driven-circles', () => {
map.getCanvas().style.cursor = '';
});
</script>
This is the only point where I have added some code to improve the user interface by showing a pop-up with the information of the point when you click on any of them. All you have to do is change [accessToken], [user] and [style] for yours.
Result
You can see the result on my Camino de Santiago website: All the Caminos in 3D.
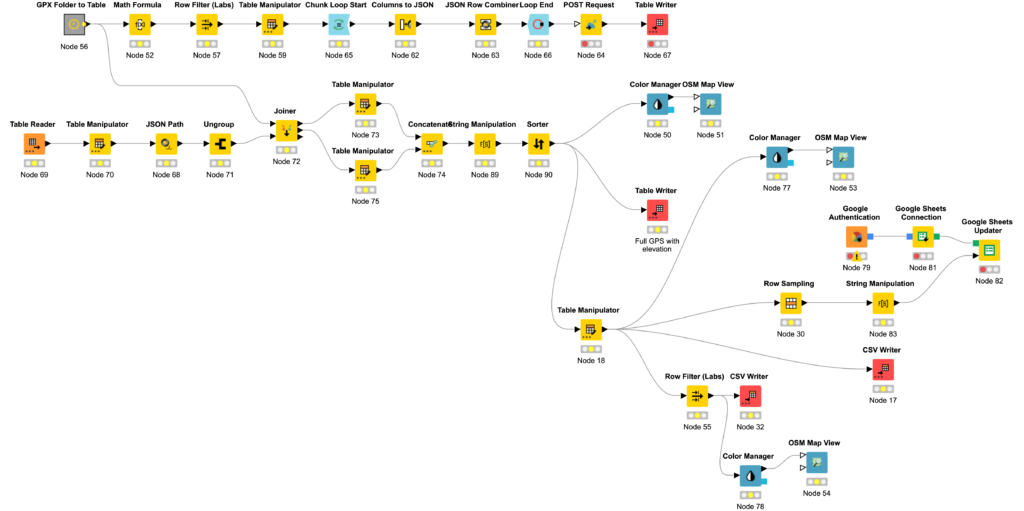
Here is also the complete workflow so that you can replicate it. I have also left it on the KNIME Hub for you to download.
Summary
- Database of GPX files with the stages of the National Center of Geographic Information (CNIG). We can never be grateful enough to the Spanish Federation of Associations of Friends of the Camino de Santiago (FEAACS) for the work of dissemination and compilation that they do. It is absolutely fundamental to build all Caminos in 3D.
- KNIME Data Analytics Platform. As you can see, I have used it mainly for the process of ingesting, transforming and updating data before uploading it to data visualization services. On this occasion, the focus was on updating the elevation data to generate the profiles of the selected stages, variants and Caminos.
- Open Elevation API. As they describe themselves: “Open-Elevation is a free, open source alternative to the Google Elevation API and other similar offerings.” Same #nocode philosophy: access to your API service with POST nodes and JSON Row Combiner to generate the request for those track points that had no associated elevation data. Really easy.
- MapBox. Possibly one of the best map services that already in its free version offers a lot of functionalities. Their mapbox Studio suite is a small wonder for generating maps. It also enables 3D visualization with an impressive degree of detail. To load the data I have used a simple CSV file with the information of the points.
New GPX files are now available for automated processing and increased coverage.
Future Improvements
Here are some improvements that I would like to work on with a little more time:
- Include the modules to do the loading and updating in the system automatically using the API provided by mapbox.
- Automatically connect to the download area of the Spanish Federation of Associations of Friends of the Camino de Santiago (FEAACS) to increase the number of supported routes: the European ones.